Finding ways to help a business grow is a top priority for most companies. It doesn’t matter if you manage a small business, mid-size company, or corporate, there will come times when the business will need further business development. One way to keep a business grow year by year is to use automated multi-source reports or automated data reporting.
Benefits of automated multi-source reports
To grow your business, you need to be informed about what is working and not working with your business operations and sales conversions. If you attempt to inform your organization by manually extracting data to create reports, you will find yourself wasting both time and money. Instead, automate report generation to end the need to merge data from multiple sources and crunch numbers to make standard reports.
Here are a few reasons to take advantage of automated multi-source reports
- Organized reports. Report automation gives you the opportunity to generate reports anytime you need to give updated reports. Not only will need fewer resources to create reports but you will cut the need to hire new analysts.
- Generate more reports in less time. With automated reporting, you will have more time on your hands to focus on pioneering projects and not wasting valuable time performing repetitive tasks. In short, your company will become more productive and efficient with its day-to-day operations. You will also have the ability to generate detailed, new reports quickly.
- Be more accurate. Anyone who has manually created a report, knows it is common to see typos as well as cut and paste errors. It is a hassle to make updates to old reports to make them more professional. By automating your reports, you cut out manual errors such as broken formulas / macros and missing values or references. Learn about report automation.
Stop wasting time and resources. Today’s technology is available to make it easy for you to deliver valuable metrics in a format you need. Report automation will make sure you have all the multiple data sources and the relevant data aspects in a comprehensive report. Learn about the key benefits of report automation, such as freeing up time, getting immediate access to report data, and focus on analyzing the data instead of pulling the data.
Recommended Saas for automated reports
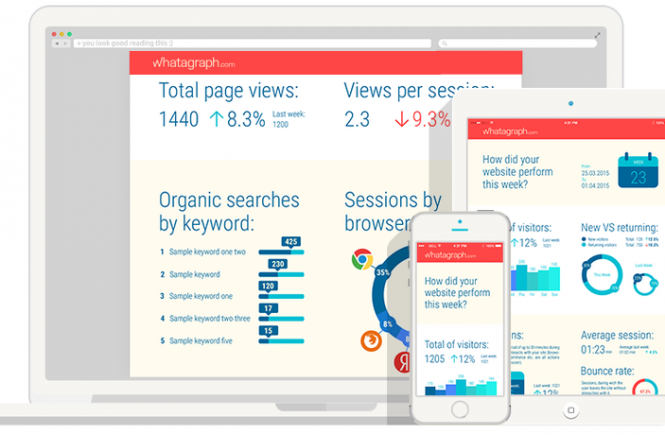
Whatagraph is a Saas which simplifies Google Analytics, AdWords, LinkedIn, Facebook, Facebook Ads, Twitter, and Instagram data for businesses to create visual infographic reports. Why doe that matter?
Visual automated reports business leadership and marketing teams save time and money by presenting data analytics in a way business teams and clients can easily understand what is working and what can be done better.
By using Whatagraph you can:
- Track and understand your data better by using visual reports that show the ins and outs of your website, e-commerce site, and even your digital campaigns performance.
- Set up automated report delivery to make sure anyone who needs the latest data is up-to-date
- Create custom reports to show your most valuable metrics while still presenting a well branded report. Yes, you can add your own logo and change the color scheme for brand consistency
- Generate automated reports within seconds and easily download to PDF
Learn more about Whatagraph and join now to simplify your process of sharing data analytics with your departments and clients. These infographic reports are more engaging and helpful than manually reports. See for yourself and let us know how it benefits your business.